Daily News
|
EUR/USD Forecast January 05, 2015: Technical Analysis
As we have expected Greenback continued its strength against the single currency as the Head of European Central Bank
more... Fundamental Analysis
As we have expected Greenback continued its strength against the single currency as the Head of European Central Bank Mario Draghi has confirmed last week an imminent action of the ECB to boost the economy and tackle the inflation may take place anytime soon.
ECB is under pressure to proceed with further monetary easing while the Federal Reserve is likely to raise interest rate this year.
.
|  |
| Technical Analysis
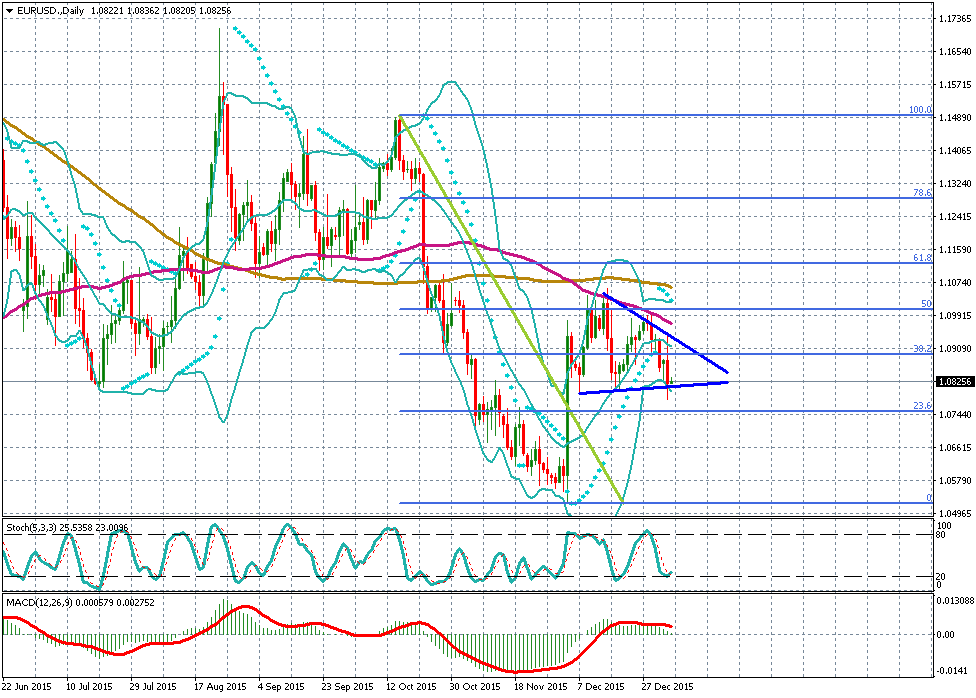
In very low liquidity sessions as most of traders are coming back from year-end holidays, the EUR/USD pair dropped below $1.2000 strong support line. EUR/USD prices are trading below its moving average supporting further decline.
We expect the outlook to remain bearish in 2015 for the pair, so any rally to resistance lines provides opportunities to intraday traders to short the pair.
| Resistance 2 | Resistance 1 | Current Prices | Support1 | Support 2 |
|---|
| 1.2085 | 1.2070 | 1.1934 | 1.1909 | 1.1875 |
To know the next target of the other currency pairs: Pound, Gold, Silver …. please visit Capitol Academy website , and register in the Daily Newsletters
www.capitol-academy.com/en/form_fx.html
And start receiving buy and sell signals, with Entry and Take profit prices.
For more info please contact us at: info@capitol-academy.com
|
Previous Technical Analysis of this week
EUR/USD Forecast December 31, 2014: Technical Analysis Fundamental Analysis
EUR/USD pair steadied around $1.2150 since most of traders left for year-end holidays. In 2015, Greenback is expected to continue its strength against the single currency as the European Central Bank is under pressure to proceed with further monetary easing while the Federal Reserve is likely to raise interest rate anytime soon.
.
|  |
| Technical Analysis
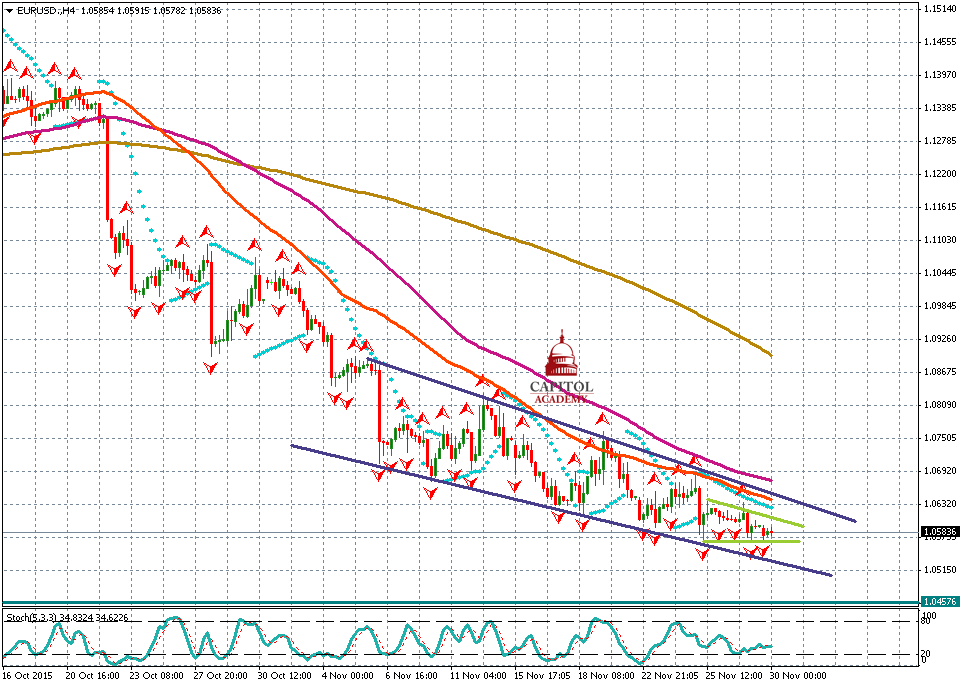
In very low liquidity sessions due to year-end and holidays, EUR/USD prices are trading below all Ichimoku Indicators supporting further decline in coming weeks. We expect the outlook to remain bearish in 2015 for the pair, so any rally to resistance lines provides opportunities to intraday traders to short the pair with major target at $1.2021.
| Resistance 2 | Resistance 1 | Current Prices | Support1 | Support 2 |
|---|
| 1.2302 | 1.2178 | 1.2154 | 1.2061 | 1.2021 |
To know the next target of the other currency pairs: Pound, Gold, Silver …. please visit Capitol Academy website , and register in the Daily Newsletters
www.capitol-academy.com/en/form_fx.html
And start receiving buy and sell signals, with Entry and Take profit prices.
For more info please contact us at: info@capitol-academy.com
|
|
|
Gold Forecast February 02, 2015 Technical Analysis
The Gold steadied near $1280 per ounce on Monday, after hitting its highest monthly gain in 3 years
more... Fundamental Analysis
The Gold steadied near $1280 per ounce on Monday, after hitting its highest monthly gain in 3 years, and growing worries concerning the slow global economic growth have increased the bullion demand as a safe haven asset.
In fact, the data released during the weekend have showed the shrinking of China factory sector during the month of January for the first time since 2012. On the other hand, a report released on Friday indicated that the U.S. gross domestic product data has declined sharply during the fourth quarter of the previous year.
|  |
| Technical Analysis
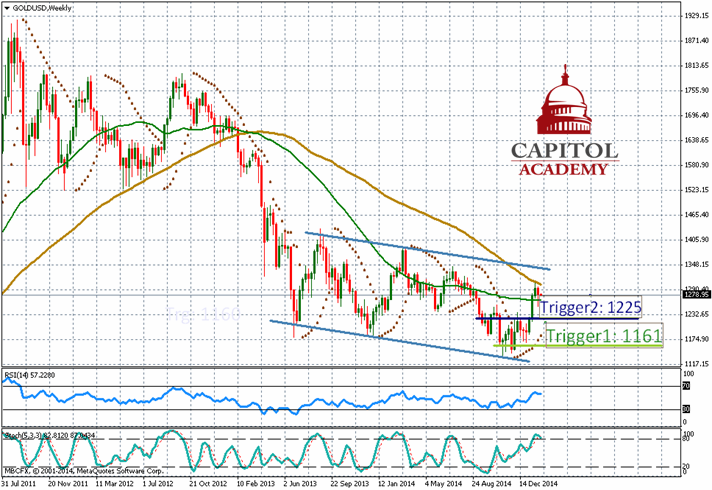
The demand for Gold as a safe haven asset remains increasing amid the increasing political and economic tensions, and the prices rebounded significantly on Friday, the steadied around $1280 per ounce. And the general trend for the yellow metal on the medium and long ter trading remain bullish, in which the Gold has faced a strong barrier around the simple moving average 100, which pushed the Gold slightly down, however, as we can see on the weekly chart the prices are in process to prepare for a strong bullish wave. And the Gold has succeeded to remain steady above the Trigger "Vic's 2B Bottom", which confirms the recover of the prices toward the main targets of $1286, $1294 and then $1303 per ounce. Concerning the medium term trading, we expect a recover of the Gold toward $1323, and $1340 per ounce. So the Gold represent good opportunities to buy during this period .
To follow the rest of the technical analysis and to know the next target of the Pound, Gold, Silver… and other currency pairs please subscribe to Capitol Academy Daily Newsletters on:
www.capitol-academy.com/en/form_fx.html
And start receiving buy and sell signals, with Entry and Take profit prices.
|
Previous Technical Analysis of this week
Gold Forecast January 28, 2015 : Technical Analysis Fundamental Analysis
The Gold rebounded to 5 months high on Monday after the victory of the Greece anti-austerity party, which provoked fears of renewed instability in Europe, increasing safe-haven demand for bullion.
Greek leftist leader "Alexis Tsipras " become prime minister of the first euro zone government opposed to bailout conditions imposed by the European Union and International Monetary Fund during the economic crisis
|  |
| Technical Analysis
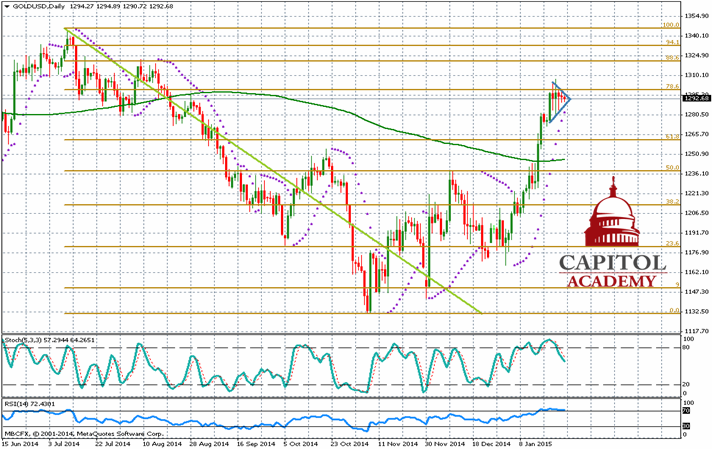
The yellow metal has reached a recover by 8.5 % since 2015 hitting the highest level on $1307.50 per ounce. And after the significant rebound, the Gold has entered within a correction step into a sideways triangle, which confirms some decline of the prices, then we expect a significant rebound confirmed by the break above the 1298 level, then it will rise toward the Fibonacci level 78.6 % around $1300,then $1314 and $1324. Which is the main general target of the Gold. as we can see on the daily chart the Gold has succeeded to break above the MA (200), and confirms further recover of the prices
To follow the rest of the technical analysis and to know the next target of the Pound, Gold, Silver… and other currency pairs please subscribe to Capitol Academy Daily Newsletters on:
www.capitol-academy.com/en/form_fx.html
And start receiving buy and sell signals, with Entry and Take profit prices.
|
Fundamental Analysis
The Gold rebounded to 5 months high on Monday after the victory of the Greece anti-austerity party, which provoked fears of renewed instability in Europe, increasing safe-haven demand for bullion.
Greek leftist leader "Alexis Tsipras " become prime minister of the first euro zone government opposed to bailout conditions imposed by the European Union and International Monetary Fund during the economic crisis
|  |
| Technical Analysis
The yellow metal has reached a recover by 8.5 % since 2015 hitting the highest level on $1307.50 per ounce. And after the significant rebound, the Gold has entered within a correction step into a sideways triangle, which confirms some decline of the prices, then we expect a significant rebound confirmed by the break above the 1298 level, then it will rise toward the Fibonacci level 78.6 % around $1300,then $1314 and $1324. Which is the main general target of the Gold. as we can see on the daily chart the Gold has succeeded to break above the MA (200), and confirms further recover of the prices
To follow the rest of the technical analysis and to know the next target of the Pound, Gold, Silver… and other currency pairs please subscribe to Capitol Academy Daily Newsletters on:
www.capitol-academy.com/en/form_fx.html
And start receiving buy and sell signals, with Entry and Take profit prices.
|
Fundamental Analysis
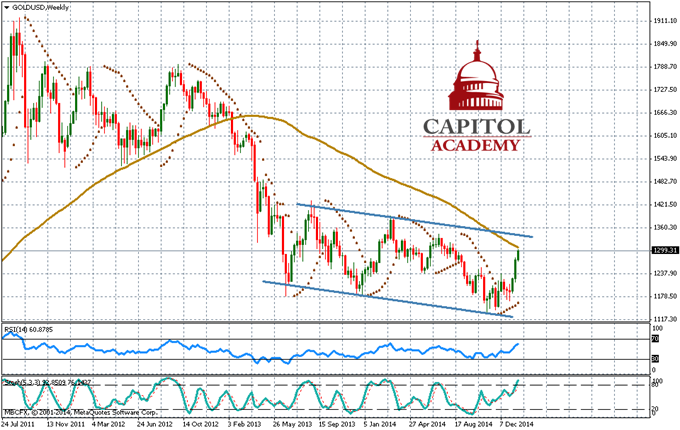
The Gold rebounded significantly hitting $ 1300 per ounce due to worries over the global economy and hopes of stimulus measures from the European Central Bank, which has increased the demand for gold as a safe-haven asset.
In addition, the decline of oil prices, and the International Monetary Fund cut its global growth forecast for 2015 have increased in demand for the yellow metal.
|  |
| Technical Analysis
The Gold remains moving within an Ascending channel and is in process to recover toward the SMA around $1309 per ounce. Which is considered as a strong barrier for the prices. And a break above this level can send the Gold toward the upper line of the Ascending channel at $1321 per ounce.
To follow the rest of the technical analysis and to know the next target of the Pound, Gold, Silver… and other currency pairs please subscribe to Capitol Academy Daily Newsletters on:
www.capitol-academy.com/en/form_fx.html
And start receiving buy and sell signals, with Entry and Take profit prices.
|
Fundamental Analysis
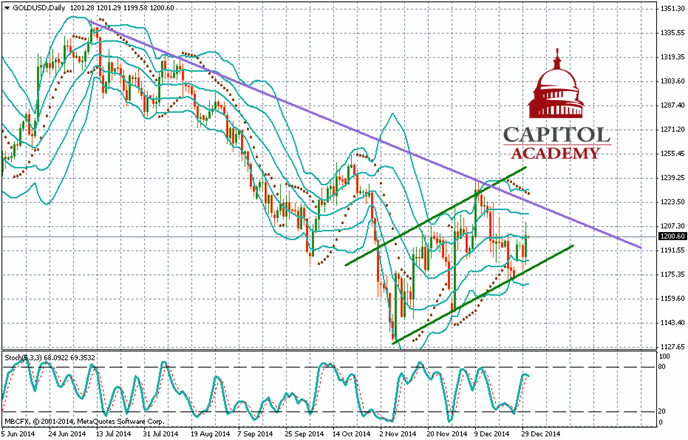
The Gold extended gains on Wednesday as worries about Greece future in the euro area , which provoked a sell-off in equities and an increase demand of the yellow metal as a safe-haven asset.
|  |
| Technical Analysis
The Gold recovered toward the expected targets of $1203 and $1209 per ounce. And today we expect some downward correction of the prices after facing a strong barrier around the SMA 20, and may push the Gold down to trade below $1200, then $1196 and $1193 per ounce.
But as we have mentioned at the beginning of this week that any downward correction would represent good opportunities to enter buy positions. As the Gold is expected to resume its bullish trend toward $1203, then to $1213 per ounce.
However the Gold is expected to remain in a range trading due to thin liquidity and the exit of the investors from trading on New Year vacations. So the market is expected to resume its trading at the next week from the New Year 2015.
| Resistance 2 | Resistance 1 | Current Prices | Support1 | Support 2 |
|---|
| 1213 | 1209 | 1201 | 1196 | 1193 |
To follow the rest of the technical analysis and to know the next target of the Pound, Gold, Silver… and other currency pairs please subscribe to Capitol Academy Daily Newsletters on:
www.capitol-academy.com/en/form_fx.html
And start receiving buy and sell signals, with Entry and Take profit prices.
|
Fundamental Analysis
The Gold extended gains on Wednesday as worries about Greece future in the euro area , which provoked a sell-off in equities and an increase demand of the yellow metal as a safe-haven asset.
|  |
| Technical Analysis
The Gold recovered toward the expected targets of $1203 and $1209 per ounce. And today we expect some downward correction of the prices after facing a strong barrier around the SMA 20, and may push the Gold down to trade below $1200, then $1196 and $1193 per ounce.
But as we have mentioned at the beginning of this week that any downward correction would represent good opportunities to enter buy positions. As the Gold is expected to resume its bullish trend toward $1203, then to $1213 per ounce.
However the Gold is expected to remain in a range trading due to thin liquidity and the exit of the investors from trading on New Year vacations. So the market is expected to resume its trading at the next week from the New Year 2015.
| Resistance 2 | Resistance 1 | Current Prices | Support1 | Support 2 |
|---|
| 1213 | 1209 | 1201 | 1196 | 1193 |
To follow the rest of the technical analysis and to know the next target of the Pound, Gold, Silver… and other currency pairs please subscribe to Capitol Academy Daily Newsletters on:
www.capitol-academy.com/en/form_fx.html
And start receiving buy and sell signals, with Entry and Take profit prices.
|
|
|
GBP/USD Forecast January 20, 2015: Technical Analysis
Crude oil remains the main driver of financial markets and the oil
more... | Fundamental Analysis
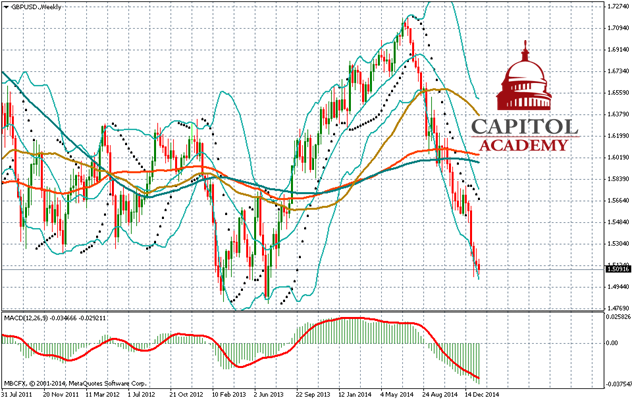
Crude oil remains the main driver of financial markets and the oil dropped sharply after the release of economic data which showed that the Chinese economic growth retreated lower than expectations hitting the weaker pace of growth in 24 years.
On the other hand, the International Monetary Fund has cut its forecast today for the world economic growth for the current year 2015, rising fears and worries among all financial markets
|  |
| Technical Analysis
The Cable recovered significantly since the second half of 2013 till the second half of 2014 hitting $1.72. Then the pair has witnessed the shift of the trend from bullish to bearish. And now remains trading around $1.51 and we expect further decline of the prices toward the key support level of $1.4860, which will represent good point to initiate buy positions.
To follow the rest of the technical analysis and to know the next target of the Pound, Gold, Silver… and other currency pairs please subscribe to Capitol Academy Daily Newsletters on
http://www.capitol-academy.com/en/form_fx.html
And start receiving buy and sell signals, also taking profit levels.
|
Previous Technical Analysis of this week
GBP/USD Forecast January 5, 2015: Technical Analysis | Fundamental Analysis
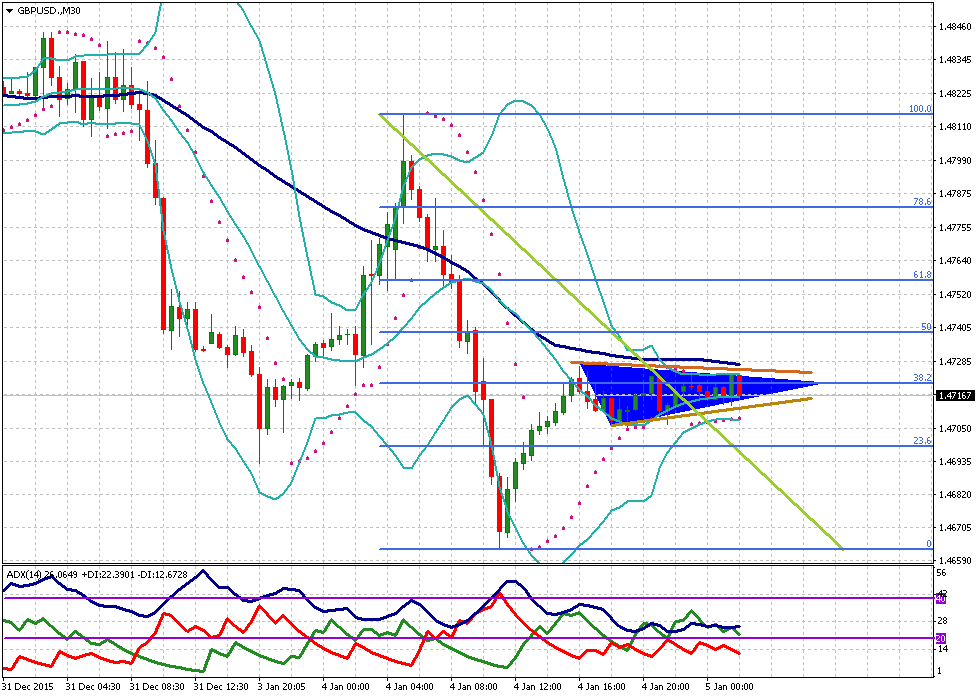
As we have expected Greenback strengthened against the cable as the Federal Reserve is under pressure to raise interest rate this year while the head of the Bank of England has excluded any interest increase. Also, general election in U.K. in May is weighing on the British Pound.
|  |
| Technical Analysis
GBP/USD pair dropped below Fibo 61.8%--78.6% zone signaling further decline for the pair. However, prices succeeded to find support just above a strong support which will pave the way for a temporary correction toward $1.5253--$1.5289 zone before prices will resume its decline below $1.5218.
| Resistance 2 | Resistance 1 | Current Prices | Support1 | Support 2 |
|---|
| 1.5323 | 1.5289 | 1.5268 | 1.5218 | 1.5190 |
To follow the rest of the technical analysis and to know the next target of the Pound, Gold, Silver… and other currency pairs please subscribe to Capitol Academy Daily Newsletters on
http://www.capitol-academy.com/en/form_fx.html
And start receiving buy and sell signals, also taking profit levels.
|
|
|
Silver January 22, 2015: Technical Analysis
The Silver retreated slightly then steadied around $18 per ounce on Thursday
more...
|
Fundamental Analysis
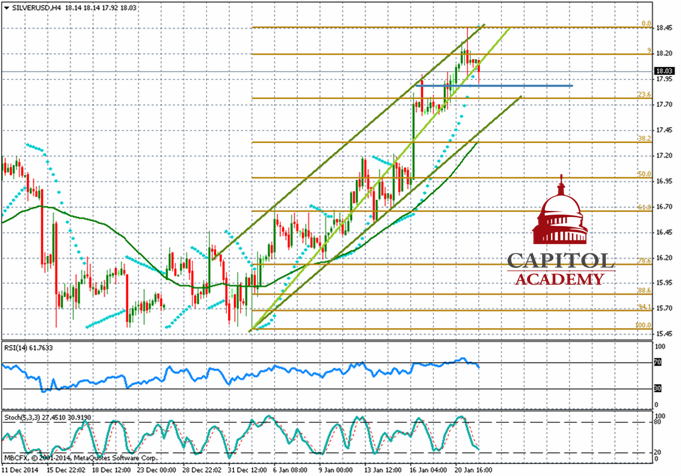
The Silver retreated slightly then steadied around $18 per ounce on Thursday, hurt by profit-taking ahead of the European Central Bank decision due today concerning the stimulus measures, also the strong Asian equities have decreased the safe-haven demand of the precious metals
|  |
| Technical Analysis
The Silver remains trading within an Ascending channel, where the prices have faced a strong barrier around the upper line of the channel, then entered within a downward correction step after the gains since the beginning of 2015. However the prices are now facing a strong barrier around the support level of $17.89 which corresponds to the Vic's 2B Trigger, which is considered as the shift point between the bullish trend and the bearish trend. As long as the silver remains trading above the mentioned level, the prices represent good opportunities to enter buy positions which is the main expected scenario. However if the Silver break below $17.89 and the candle will close below this level, it will confirm the bearish trend toward $16.97.
And to follow the rest of the technical analysis, to know when to enter the market, register now on our website
http://www.capitol-academy.com/en/form_fx.html
And start receiving buy and sell signals, also taking profit levels.
|
Previous Technical Analysis of this week
Silver Forecast July 16, 2014: Technical Analysis |
Fundamental Analysis
The Silver continued its wave of losses against the US Dollar for the 4th consecutive day hitting $ 20.65 per ounce, after Janet Yellen suggested the Federal Reserve may have to raise interest rates sooner if the labor market continues to improve faster than expectations. She also claimed that the Fed will keep the current monetary policy until the recover of the U.S. labor market.
| |
| Technical Analysis
As we can see on the H4 chart, the Silver declined for the third consecutive day and broke the EMA(100) and the Fibonacci level 23.6 % hitting $20.66 per ounce. And by the formation of the Classic Bullish Divergence between the trend of the prices and the Stochastic trend, we expect a slight recover of the Silver toward the main targets stated in our daily Newsletters.
And to follow the rest of the technical analysis, to know when to enter the market, register now on our website
http://www.capitol-academy.com/en/form_fx.html
And start receiving buy and sell signals, also taking profit levels.
|
|
Fundamental Analysis
Silver dropped sharply against the U.S. dollar due to profit-taking amid strong rebound of the U.S. stock markets, which increased the risk appetite among investors while dented the precious metals safe haven demand. Today the traders will focus on Janet Yellen testimony to see if there are any future changes in Fed monetary policy and when the first rate hikes will begin.
| |
| Technical Analysis
As we can see on the daily chart, the Silver prices declined significantly toward the Fibonacci level 61.8 % hitting $20.83 per ounce and represented a strong barrier. And as long as the prices will remain trading above the $20.80, we expect a slight recover of the prices toward the main targets stated in our daily Newsletters.
And to follow the rest of the technical analysis, to know when to enter the market, register now on our website
http://www.capitol-academy.com/en/form_fx.html
And start receiving buy and sell signals, also taking profit levels.
|
|
Fundamental Analysis
The Silver retreated slightly against the U.S. dollar on Monday amid the rebound of the Asian stock markets, but the white metal remained trading near its highest level in four months, which has recorded on the last week due to the high demand for the precious metals as safe haven assets amid the escalating tensions in the Middle East as well as in Ukraine .
| |
| Technical Analysis
As we can see on the daily chart, the Silver retreated toward the middle line of the Bollinger Bands around $21.05 per ounce, and as long as the prices remain trading above the $20.98 level, it would represent good opportunities to enter buy positions on the intraday movement and take profits at the main levels stated in our daily Newsletters.
And to follow the rest of the technical analysis, to know when to enter the market, register now on our website
http://www.capitol-academy.com/en/form_fx.html
And start receiving buy and sell signals, also taking profit levels.
|
|
|
USD/JPY Forecast June 16, 2014: Technical Analysis
As we can see on the H4 chart, the Dollar Yen broke through the Ascending Flag and the SMA (200), (100) and more... Fundamental Analysis
The Japanese Yen rose significantly amid the sharp drop of the global stock markets and expectations and concerns about the decrease of the high growth rates which were affected by the significant rebound of the oil prices while the governments are trying to activate stimulus measures to support economic growth.
The recent events in Iraq, which affected negatively the Iraq's oil exports, which have pushed the crude oil prices higher.
Concerning the U.S. economy, the investors are waiting for the FOMC decision, the inflation data, the US house price index and the Fed manufacturing index.
| |
| Technical Analysis
As we can see on the H4 chart, the Dollar Yen broke through the Ascending Flag and the SMA (200), (100) and (300) to the downside.
The prices are now moving above the Fibonacci level 50% around 101.834 yen and we expect some recover of the prices toward the main targets stated in our daily Newsletters.
To know the expected scenario of the USD/JPY, and follow the rest of the technical analysis, and to know the next target of this pair and other currencies, register now on our website
http://www.capitol-academy.com/en/form_fx.html
And start receiving buy and sell signals, also taking profit levels.
|
Previous Technical Analysis of this week
USD/JPY Forecast June 16, 2014: Technical Analysis Fundamental Analysis
The Japanese Yen rose significantly amid the sharp drop of the global stock markets and expectations and concerns about the decrease of the high growth rates which were affected by the significant rebound of the oil prices while the governments are trying to activate stimulus measures to support economic growth.
The recent events in Iraq, which affected negatively the Iraq's oil exports, which have pushed the crude oil prices higher.
Concerning the U.S. economy, the investors are waiting for the FOMC decision, the inflation data, the US house price index and the Fed manufacturing index.
| |
| Technical Analysis
As we can see on the H4 chart, the Dollar Yen broke through the Ascending Flag and the SMA (200), (100) and (300) to the downside.
The prices are now moving above the Fibonacci level 50% around 101.834 yen and we expect some recover of the prices toward the main targets stated in our daily Newsletters.
To know the expected scenario of the USD/JPY, and follow the rest of the technical analysis, and to know the next target of this pair and other currencies, register now on our website
http://www.capitol-academy.com/en/form_fx.html
And start receiving buy and sell signals, also taking profit levels.
|
|
|
USD/CAD Forecast March 26, 2014: Technical Analysis
The US dollar remains in steady trading after its rally yesterday on positive US Consumer Price Index more... | Fundamental Analysis
The US dollar remains in steady trading after its rally yesterday on positive US Consumer Price Index ( roe to 82.3) which is the highest level since January 2008.
The major events to watch today are : , U.S. Core Durable Goods Orders (MoM) and FOMC member Bullard Speech constitute the major news for the day to be followed
| |
| Technical Analysis
As we can see on the H1 chart, the dollar loonie steadied around the Fibonacci level 50 % at 1.1150, and a break through this level to the downside, will send the prices toward the main support area stated in our daily Newsletters.
To know the expected scenario of the USD/CAD, and follow the rest of the technical analysis, and to know the next target of this pair and other currencies, register now on our website
http://www.capitol-academy.com/en/form_fx.html
And start receiving buy and sell signals, also taking profit levels.
|
Previous Technical Analysis of this week
USD/CAD Forecast March 21, 2014: Technical Analysis | Fundamental Analysis
The Measures of inflation for the Canadian economy was better than expected as retail sales increased 1.3 % compared with the previous reading for the month of December. Also the consumer price index rose 0.7% on February compared to the previous reading, which showed an increase of 0.2%, and better than expectations that indicated to rise by 0.5 %
On the other hand, the U.S. dollar remained strong against a basket of other currencies. Also the Philadelphia index released on Thursday give another sign of improving US economy during the month of March. Also the unemployment rates fell to 320 thousand in March, compared to February reading which recorded 335 thousand, which indicates a marked improvement in the growth rate of U.S. employment .
| |
| Technical Analysis
As we can see on the H1 chart, the dollar loonie is trading within the Ichimoku Cloud and the prices have breached down the Fibonacci level 23.6%, and we expect further decline toward the Fibonacci level 38.2% around 1.1180.
To know the expected scenario of the USD/CAD, and follow the rest of the technical analysis, and to know the next target of this pair and other currencies, register now on our website
http://www.capitol-academy.com/en/form_fx.html
And start receiving buy and sell signals, also taking profit levels.
|
|
|
EUR/JPY Forecast March 21, 2014: Technical Analysis
After the release of the performance of the key sectors in the euro area during the previous week, we wait for the data more... | Fundamental Analysis
Japan recorded a trade deficit of 800.31 Billion yen means (5.6 billion euros) in February 2014 due to the decline of the yen certainly raise exports, but also increases the cost of imports.
| |
| Technical Analysis
As we can see on the H4 chart, the Euro Yen prices remain in a range trading between the 142 and 140.80 yen levels. Which represents the Fibonacci Retracement 38.2%, and it is expected to break through the SMA (300) to the downside and continue its bearish trend?
To know the expected scenario of the EUR/JPY, and follow the rest of the technical analysis, and to know the next target of this pair and other currencies, register now on our website
http://www.capitol-academy.com/en/form_fx.html
And start receiving buy and sell signals, also taking profit levels.
|
|
|
GBP/JPY Forecast March 20, 2014: Technical Analysis
Japan recorded a trade deficit of 800.31 Billion yen means (5.6 billion euros) in February 2014
more... | Fundamental Analysis
Japan recorded a trade deficit of 800.31 Billion yen means (5.6 billion euros) in February 2014 due to the decline of the yen certainly raise exports, but also increases the cost of imports.
As for the British currency, the U.K government announced on Wednesday, March 19, an increase in its economic forecasts for 2014 and 2015 to reflect the improvement of the economy, which was confirmed during the first months of the year . Indeed, the minister of economy George Osborne, forecasted a growth of 2.7% in 2014 while he was considering an expansion of 2.4%, and 2.3% in 2015 instead of 2.2%.
| |
| Technical Analysis
As we have mentioned in our technical analysis of yesterday, the Pound Sterling rebounded slightly against the yen after the formation of Divergence between the trend of the prices and the Stochastic trend hitting ¥ 169.68 level , which corresponds to the SMA(200 and represented a strong barrier for the prices, then the Pound Yen retreated around 169 yen.
Prices are expected to fall toward the main support levels stated in our daily Newsletters.
To follow the rest of the technical analysis , and to know the next target of this pair and other currencies, register now on our website
http://www.capitol-academy.com/en/form_fx.html
And start receiving buy and sell signals, also taking profit levels.
|
Previous Technical Analysis of this week
GBP/JPY Forecast March 19, 2014: Technical Analysis | Fundamental Analysis
The Japanese Yen dropped sharply during the previous sessions, which provoked high import costs, prompting a widening trade deficit, which reached 800.3 billion yen, and increased concerns and fears about the recovery of the Japanese economy.
On the other hand, the investors are waiting today for the BoE MPC meeting and the release of the UK jobless claims report, which is expected to record a decline of (-25.0k), a better than expected data will push the Sterling Pound to rebound.
| |
| Technical Analysis
The Pound Yen remains trading above the Fibonacci level 61.8% , which reflects the pair is in process of down trend corrections step of the general bullish trend.
To follow the rest of the technical analysis , and to know the next target of this pair and other currencies, register now on our website
http://www.capitol-academy.com/en/form_fx.html
And start receiving buy and sell signals, also taking profit levels.
|
| Fundamental Analysis
Concerning the British economy, we are waiting for the FOMC meeting for this month, also the announcement of the labor market data which is expected to keep the unemployment rate in the three months rate of 7.2 percent, means unchanged from the previous reading.
The investors and global market are holding the major event for this week which is the FOMC meeting regarding the U.S. federal monetary policy for the next time and whether to continue tapering the QE program , and the speech of the Fed president “Janet Yellen” .
The Federal reserve bank is widely expected to keep interest rates lowest level between 0.00 % and 0.25 % .
| |
| Technical Analysis
As we can see on the daily chart, the Pound Yen prices did not succeed to break through the Fibonacci level 38.2% to the downside, and bounced up toward the Fibonacci level 50 % . and this is what we have mentioned in our technical analysis of March 14th 2014, then we expect that the pair will continue its recover toward the following main targets.
To follow the rest of the technical analysis , and to know the next target of this pair and other currencies, register now on our website
http://www.capitol-academy.com/en/form_fx.html
And start receiving buy and sell signals, also taking profit levels.
|
|
|
AUD/USD Forecast March 11, 2014: Technical Analysis
Investors are waiting for jobs report and the unemployment rate in Australia ,while they wait the release more... | Fundamental Analysis
Investors are waiting for jobs report and the unemployment rate in Australia ,while they wait the release of U.S economic news which will add some dynamic to the market including the US Retail Sales and the PPI which measure the inflation rate, also other news including the Jobless Claims report.
| |
| Technical Analysis
As we can see on the daily chart, the Aussie Dollar ha finished its Pullback step of the Inverted Head and Shoulders, then steadied around the Kijun-Sen level of the Ichimoku Cloud ahead of the major economic data releases.
And to follow the rest of the technical analysis, to know when to enter the market, register now on our website
http://www.capitol-academy.com/en/form_fx.html
And start receiving buy and sell signals, also taking profit levels.
|
|
|
EUR/GBP Forecast February 21, 2014: Technical Analysis
The single currency suffered from disappointing data released from France and Germany which has raised deflation more... | Fundamental Analysis
The Euro Pound rebound after the release of positive German data, but quickly the pair reduced gains after an official said the European Central Bank is ready to cut interest rates on deposits if necessary.
The investors’ main attention turns this week to the GDP data for the fourth quarter, which is expected to decline to 0.7%, lower than the third quarter growth rate of 0.8%.
| |
| Technical Analysis
The Euro Pound has kept is sideways trading for many sessions forming a correction step within a Descending Flag. However at the beginning of this week, the prices broke through the Descending Flag to the upside and we notices a significant bullish wave hitting 0.8386, then the pair resumed its Pullback.
To know the expected scenario of the EUR/GBP, and follow the rest of the technical analysis, and to know the next target of this pair and other currencies, register now on our website
http://www.capitol-academy.com/en/form_fx.html
And start receiving buy and sell signals, also taking profit levels.
|
Previous Technical Analysis of this week
EUR/GBP Forecast February 21, 2014: Technical Analysis | Fundamental Analysis
The single currency suffered from disappointing data released from France and Germany which has raised deflation concerns and growth risk in euro-zone.
In U.K Traders may turn today to existing home sales data for the month of January, which is expected to drop to 1% (YoY) less than the previous ready of 2.6%.
They need also to keep an eye on the G20 meeting of finance ministers and central bank chiefs, taking place this weekend in Sydney.
| |
| Technical Analysis
As we can see on the H4 chart, the Euro Pound is trading within a symmetrical triangle. And we expect that the prices will break through this triangle to upside toward the next expected targets that we will mention in our daily Newsletters.
To know the expected scenario of the EUR/GBP, and follow the rest of the technical analysis, and to know the next target of this pair and other currencies, register now on our website
http://www.capitol-academy.com/en/form_fx.html
And start receiving buy and sell signals, also taking profit levels.
|
|
|
AUD/NZD Forecast February 19, 2014: Technical Analysis
s we can see on the weekly chart, the Aussie Kiwi dropped sharply and formed the main Descending Channel more... | Fundamental Analysis
| |
| Technical Analysis
As we can see on the weekly chart, the Aussie Kiwi dropped sharply and formed the main Descending Channel. Now the pair is in process to recover toward the 1.0924 level, then to the Kijun-Sen level of the Ichimoku Cloud at 1.1094 as a general target of the pair.
To know the expected scenario of the AUD/NZD, and follow the rest of the technical analysis, and to know the next target of this pair and other currencies, register now on our website
http://www.capitol-academy.com/en/form_fx.html
And start receiving buy and sell signals, also taking profit levels.
|
|
|
USD/CHF Forecast February 14, 2014: Technical Analysis
The U.S. dollar fell again yesterday following the disappointing retail sales data and the weekly jobless claims report
more... | Fundamental Analysis
The U.S. dollar fell again yesterday following the disappointing retail sales data and the weekly jobless claims report.
The decline in these numbers is probably due to an exceptionally snowy winter this year in several U.S. cities.
On the other hand, the producer price index (PPI) in Switzerland remained stable unlike expectations, according to official figures released onThursday.
| |
| Technical Analysis
As we can see on the H4 chart the Dollar Swiss Franc has broke through the Ascending Flag and the Fibonacci level 50 % and 61.8% to the downside, and today we expect that the pair will continue its decline toward the expected targets stated in our daily Newsletters.
To follow the rest of the technical analysis , and to know the next target of this pair and other currencies, register now on our website
http://www.capitol-academy.com/en/form_fx.html
And start receiving buy and sell signals, also taking profit levels.
|
|
|
USD/CHF Forecast October 08, 2013: Technical Analysis
The USD/CHF declined and found support at 0.8992 due to government shutdown and debt ceiling in USA. The prices are more... | Technical Analysis
The Swiss Federal Statistical Office informed on Tuesday that Swiss Real Retail Sales grew 2.4% in August, up from the 0.6% increase in July and well above forecasts of +0.7%.
And we noticed that the USD/CHF remained steady above 0.90 despite the U.S debt issue as there's no sign that they will not reach an agreement on a debt ceiling plan in the near-term, with the government remained partially shutdown.
| |
Technical Analysis
Concerning the technical analysis, we expect the USD/CHF to recover toward 0.9080 franc, then toward 0.91-0.9120 area, and the bullish trend is confirmed by the Momentum indicator which has reached the 100 level.
So the Dollar Swiss is very convenient to buy for now, but we recommend our dear traders to monitor the key support level of 0.9000.
Previous Technical Analyzes of this week
Silver Forecast October 04, 2013: Technical Analysis | Technical Analysis
The USD/CHF has started the trading of this week with downtrend for two main reasons: First, as the foreign currency reserves of Swiss Franc was reduced from 434.4 billion Swiss francs to 432.2 billion in September, according to data released today by the Swiss National Bank. Secondly, as a result of failure to achieve any progress in resolving the crisis of the U.S. as US fiscal ceiling stalemate continued, and this has affected the confidence in the world's largest economy.
| |
Technical Analysis
Concerning the technical analysis, we notice on the daily chart that the Dollar Swiss prices are trading into a sideways channel within a bullish trend to confirm the upturned on the long term trading.
For the short term trading, we expect the USD/CHF pair to continue its decline toward the 0.9030-0.9020 area, then to resume its general bullish trend.
|
|
|


